Liquid blister dosing · measurement and FAT guide
Fill-volume accuracy is not one universal percentage. It is evidence that a defined dosing process, measured by a capable method, meets the product owner’s approved limits across cavities, time, operating conditions and interventions.
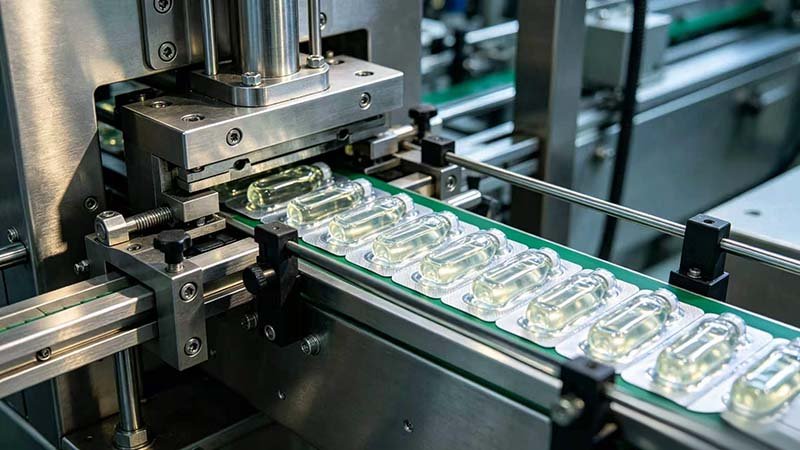
What does liquid blister fill-volume accuracy mean?
Fill-volume accuracy describes how close a measured fill is to the approved target under stated conditions. It should not be reduced to an unsupported claim such as “±1% accurate.” A useful statement names the target, limits, material, temperature, density, machine configuration, speed, sample design, measurement method and calculation.
The equipment supplier can demonstrate the configured dosing system. The product owner remains responsible for the registered or approved product specification, sampling rationale, test method, process validation and batch disposition.
Why “±1% accuracy” is an incomplete claim
The phrase can refer to a single observation, an average, a maximum deviation, a relative standard deviation, a pump-stroke reference or an internal display. Those meanings are not equivalent. It also omits the time period, number of samples, number of lanes and operating state.
For a target fill, the buyer should ask whether every individual result must fall within limits, whether the average must remain near target, whether each lane is assessed separately and how measurement uncertainty is treated. A machine may have a centered mean while individual cavities vary widely, or tightly grouped results that are consistently biased high or low.
Separate accuracy, precision, bias and uncertainty
| Term | Question it answers | Useful calculation or evidence | Common mistake |
|---|---|---|---|
| Accuracy | How close are results to the approved target? | Difference between measured value or mean and target | Using “accuracy” to describe all variation |
| Bias | Is the process systematically high or low? | Mean minus target, expressed in volume or percent | Hiding a shifted mean inside a wide tolerance |
| Precision | How closely do repeated results agree? | Standard deviation, range or justified dispersion statistic | Assuming tight grouping means correct centering |
| Repeatability | How does the method behave under the same conditions? | Repeated measurements by the same method and setup | Mixing method variation with process variation |
| Reproducibility | What changes across analysts, days, instruments or sites? | Designed comparison of relevant measurement conditions | Qualifying one analyst and treating the result as universal |
| Uncertainty | How much doubt belongs to the reported measurement? | Justified uncertainty evaluation for the selected method | Reporting more decimal places than the method supports |
Choose whether volume or mass is the primary result
Direct volume measurement can be appropriate when the method, container and scale support it. Gravimetric measurement is often practical because mass can be measured with a balance and converted to volume using the product density at the relevant temperature.
The method must define tare, balance resolution, density determination, temperature, evaporation control, residue, bubbles and timing. If the product specification is based on mass, conversion to volume may add unnecessary uncertainty. If the label or process target is based on volume, density cannot be assumed constant without evidence.
Build a gravimetric method that measures the product—not the setup
- Identify the test unit. State whether one cavity, one strip, one card or a collected discharge is measured.
- Establish tare. Use a method that accounts for forming-web, lidding or container variation without masking fill variation.
- Control timing. Define the interval between filling and weighing where evaporation, cooling, foaming or drainage can change mass.
- Measure density and temperature. Use the approved method and relevant product condition when converting mass to volume.
- Record raw data. Retain individual values, lane, position, time, machine settings, product condition and interventions.
- Calculate after review. Apply the approved formula, rounding and outlier rules without overwriting the source observations.
Verify the measurement system before judging the filler
A dosing test cannot be stronger than the measurement process. Confirm the balance or volume device has suitable range, readability and calibration status. Verify check standards, fixtures, tare containers, data transfer and calculations.
NIST describes measurement quality in terms that include bias, short-term variability and long-term variability. That distinction is useful here: a method may repeat well during one FAT session yet shift between analysts, balances or days. Design the measurement study around the risk and the precision needed to resolve the acceptance limits.
Sampling must represent cavities, lanes and time
A single pooled sample can hide a weak filling lane. A single time point can miss warm-up, drift, refill effects or restart behavior. Build a stratified plan that connects every result to its physical source and operating state.
Position
Sample every filling lane and relevant cavity position. Preserve the map from nozzle to finished pack.
Time
Include startup, stable operation, later run periods and agreed interventions rather than one convenient window.
Conditions
Cover approved product temperature, speed, supply level and other justified operating variables.
Events
Challenge refill, stop, restart, cleaning, product change or component replacement where they affect dosing risk.
The protocol should justify sample size from the decision it must support. FDA’s process-validation Q&A states that it does not prescribe one minimum number of validation batches; the same science- and risk-based principle argues against inventing one universal FAT duration or sample count.
Use a lane map before using an overall average
Assign every nozzle or dosing outlet a stable identifier. Record the corresponding cavity, web position and finished-pack location. Calculate lane results separately before combining them.
A combined mean can look acceptable when one lane overfills and another underfills. Lane mapping helps distinguish a common product-supply issue from a valve, seal, nozzle, timing or calibration problem. It also connects a failed finished unit to the station where corrective work should begin.
Plot results over time to reveal drift and events
Keep the sequence of individual measurements. A time plot can reveal warm-up, progressive drift, cycling, refill disturbances, bubbles after priming or a step change after adjustment. Summary statistics alone discard this evidence.
Mark stops, alarms, speed changes, product additions, tank-level changes and manual adjustments on the same timeline. If the process is not stable, a capability index may be misleading because the distribution does not represent one controlled process.
Calculate statistics only after defining the decision
| Output | What it shows | Use | Limitation |
|---|---|---|---|
| Individual result | One measured cavity or unit | Checks unit limits and physical location | Does not describe the wider process alone |
| Mean | Average level | Shows centering against target | Can hide lane or time variation |
| Bias percent | Relative shift from target | Compares centering across fill targets | Must state the denominator and sign |
| Standard deviation | Observed spread | Describes precision under the sampled conditions | Sensitive to sampling design and distribution |
| RSD or CV | Spread relative to the mean | Can compare variation at different scales | Not a substitute for individual limits or bias |
| Minimum and maximum | Observed extremes | Shows the sampled range | Depends strongly on sample size |
| Cp/Cpk | Process spread and centering relative to limits | Capability assessment when assumptions are justified | Requires a stable process, adequate data and appropriate distribution assumptions |
Do not confuse specification limits with control limits
Specification limits define product or process acceptability. Control limits are calculated from process behavior and help detect unusual change. One does not replace the other.
A point inside specification can still signal loss of statistical control. A stable process can still be incapable of meeting narrow specifications. The response plan should define which signal stops the test, which requires investigation and which affects acceptance.
Product temperature can change more than viscosity
Temperature can influence viscosity, density, evaporation, bubble behavior, crystallization, phase separation and valve response. Record product temperature at a defined location rather than relying only on room temperature or a tank setpoint.
Establish the approved process range from product and process development. Test the dosing system at justified conditions within that range. Avoid fixed temperature bands copied from another product.
Rheology and formulation determine the dosing challenge
Newtonian, shear-thinning, thixotropic, foaming, suspended or particle-containing products can behave differently through hoses, manifolds, valves and nozzles. Bulk viscosity from one laboratory condition may not describe the shear and residence time inside the filler.
Provide the supplier with safe formulation information, density, rheology over the relevant range, solids, particle size, settling, aeration, sensitivity to shear and cleaning constraints. Representative trials should reproduce the properties that drive dosing risk.
Pump type alone does not prove accuracy
Peristaltic, piston, diaphragm, time-pressure and other dosing concepts each have application boundaries. Tubing, seals, valves, product contact, cleanability, stroke control, supply pressure and maintenance affect the result. Do not rank one principle universally.
Compare the configured dosing path with the actual product. Ask how volume is set, how the mechanism is verified, what parts wear, how the system is primed, what conditions change the result and what will be demonstrated during FAT.
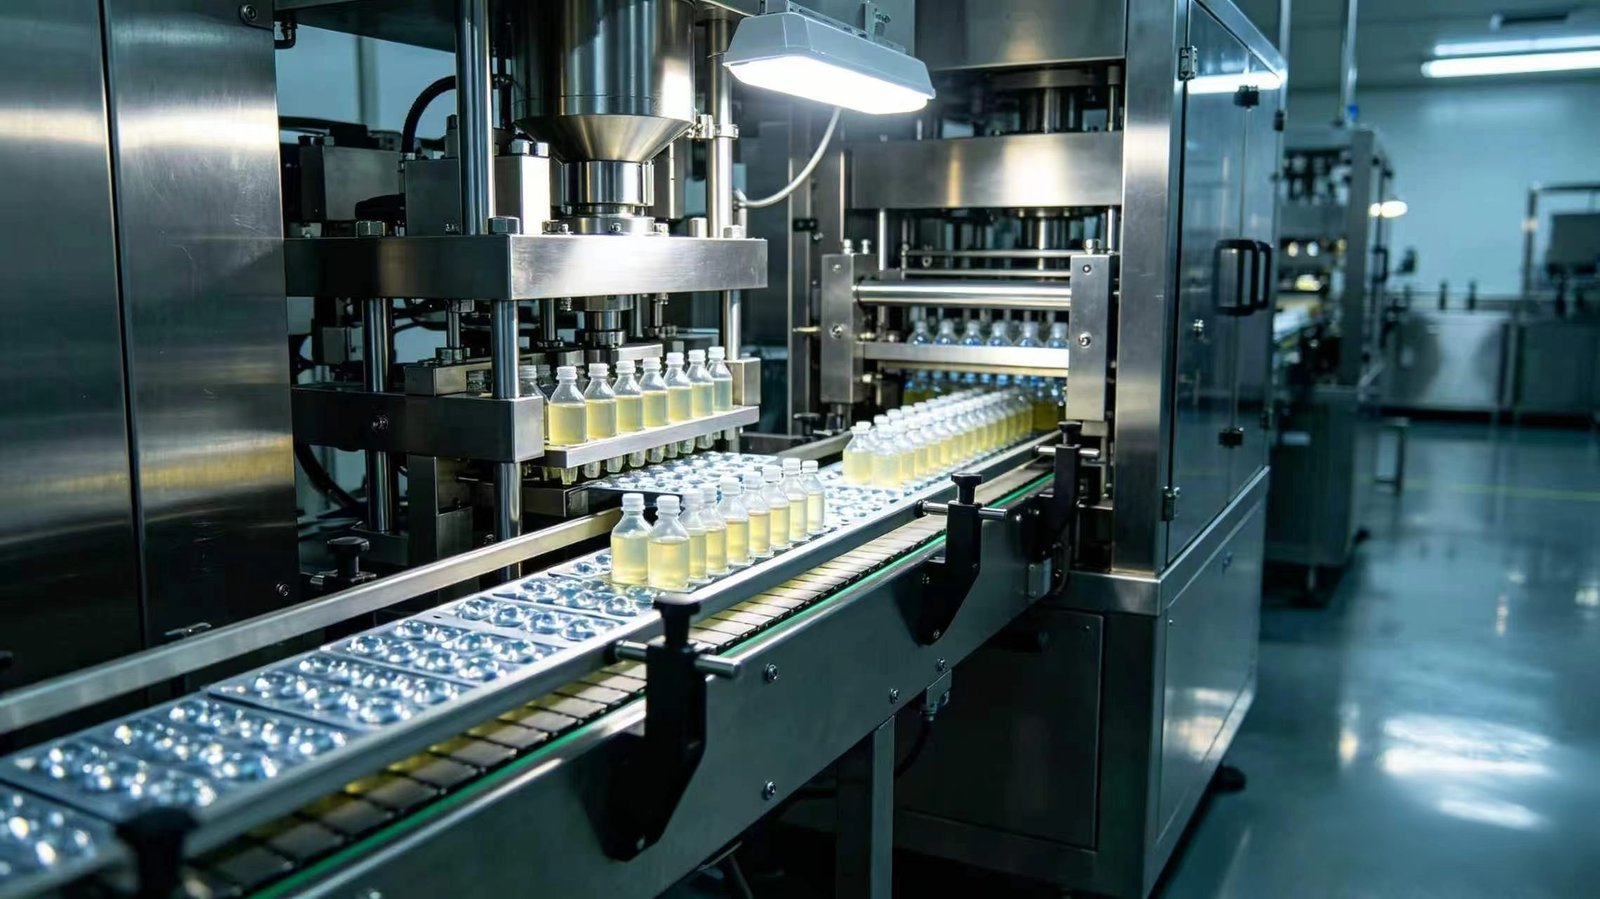
Nozzles, valves and cut-off behavior affect every cavity
Nozzle centering, height, immersion, retraction, valve timing, dripping, stringing and splashing can change the delivered amount or contaminate the seal land. A correct pump stroke does not prove that the complete dose reached the cavity.
Observe each lane during startup, stable running and stops. Inspect residual liquid at the nozzle, hoses and valve seats. Connect visual observations with the measured lane data rather than adjusting several variables at once.
Supply pressure, tank level and agitation belong in the test record
Head pressure, pump inlet condition, recirculation, tank level and agitation can influence product presentation. Refilling may introduce air, temperature change or concentration differences. Suspensions may settle or segregate without an appropriate handling strategy.
Define the normal operating range and the refill method. If low and high supply levels create different risk, include them in the test matrix. Record actual conditions, not only nominal setpoints.
Priming and trapped air can create false drift
Air in hoses, manifolds, pumps or nozzles can create short fills and unstable measurements. The protocol should define priming, recirculation, bubble removal, discarded startup units and the evidence required before sampling begins.
After a stop, hose change, cleaning or product refill, repeat the approved recovery sequence. Record how many units are rejected and where acceptable operation is re-established; do not hide recovery material outside the output calculation.
Cavity geometry and headspace affect usable fill volume
The target dose must fit the formed cavity with adequate usable headspace for filling, web movement and sealing. Nominal geometric volume is not automatically usable process volume. Forming variation, flange flatness and web motion can change the available space.
Confirm the pack drawing, cavity dimensions, nozzle path and filled-product behavior together. Overflow, splashing or product on the seal land may be caused by geometry and motion even when the pump delivers the requested amount.
Startup, restart and speed changes need separate acceptance
A stable mid-run sample does not describe the first units after startup or a restart. Temperature, pressure, priming, web acceleration and product settling can differ. Define the reject and sampling logic for each state.
Test the approved speed range and transitions that production will actually use. A result at one nominal speed should not be extrapolated to minimum or maximum speed without evidence.
Design the FAT from the URS and risk assessment
The URS should identify target fill, approved limits, product condition, dosing route, number of lanes, operating range, measurement method, data needs and acceptance responsibility. The FAT protocol then converts those requirements into observable tests.
EU GMP Annex 15 describes risk-based lifecycle qualification and validation. Supplier FAT evidence can support design review and later qualification, but it does not replace the buyer’s site-specific work.
Create a test matrix instead of one demonstration run
| Factor | Possible test levels | Why it matters | Record |
|---|---|---|---|
| Fill target | Approved low, nominal and high or justified worst cases | Resolution and pump behavior can change with dose | Recipe, parts and target |
| Product condition | Approved temperature, density, viscosity or representative boundary | Changes flow through the complete path | Method, location and actual readings |
| Speed | Approved production settings and transitions | Changes fill time, motion and settling | Actual rate and accepted output |
| Supply state | Normal high/low level and refill | Can change inlet pressure or introduce air | Tank level, refill and intervention times |
| Machine state | Startup, stable run, stop and restart | Tests recovery and reject logic | Raw units, rejects and recovery boundary |
| Lane | Every active dosing outlet | Exposes physical differences hidden by averages | Nozzle-to-cavity map |
Use representative product or a justified substitute
The best trial material represents the properties that affect dosing, cleaning and safety. When actual product cannot be shipped, define a substitute using relevant density, viscosity or rheology, foaming, solids, temperature response and product-contact constraints.
Document the limitations of the substitute. A water test can confirm basic operation but cannot automatically prove performance for syrup, suspension, oil, gel or volatile liquid. Identify which conclusions require later site testing with actual product.
Agree the accepted-output boundary during fill testing
Record total dosing cycles, filled cavities, rejected units, samples, waste, stops and interventions. State whether test output ends at filling, sealing, cutting or finished-pack inspection.
This prevents a filler from passing on isolated dose measurements while the line loses output through splashing, seal contamination, inspection rejects or restart waste. It also makes capacity and accuracy evidence comparable.
Write acceptance rules before the test starts
The protocol should define individual-unit limits, mean or bias limits, lane rules, calculation precision, treatment of invalid measurements, outlier policy, repeat testing, deviations and approval authority. Do not create the rule after looking at the data.
Specify whether a failed lane fails the entire run, whether adjustment restarts the test and how pre-adjustment data are retained. Raw data, not only a summary certificate, should support the decision.
Handle deviations without erasing the evidence
- Stop or contain as defined. Protect test material and identify the affected time and cavities.
- Preserve raw data. Keep the original measurements, settings, alarms and observations.
- Classify the issue. Separate process, product, measurement, procedure and data-handling possibilities.
- Investigate one path. Use lane and time patterns to choose the next justified check.
- Approve corrective action. Record owner, change, impact and required review.
- Retest under control. Define whether the full matrix or a justified subset must be repeated.
Understand what cameras and checkweighers can prove
A vision system may detect observable fill level, presence, foam, contamination or positional differences under qualified imaging conditions. It does not automatically measure true volume, mass, chemical content or invisible seal integrity.
A card-level checkweigher can detect total mass difference but may not identify which cavity caused it. Individual-cavity verification requires a measurement architecture and traceability path designed for that purpose. Define sensitivity, tare, reject logic and challenge tests rather than assuming “100% inspection” proves every attribute.
Electronic records depend on intended use
Define which records support regulated decisions: recipe changes, results, alarms, user actions, rejects, audit history or batch reports. Then specify access, attribution, time, retention, backup, restore, review and interface needs.
Part 11 applicability depends on the actual electronic records and signatures used to meet predicate requirements. A PLC brand or audit-trail label is not enough, and paper records are not automatically deficient merely because an electronic option exists.
Keep FAT, qualification and process validation boundaries clear
FAT confirms agreed functions and evidence before shipment. IQ confirms the installed system and documentation. OQ challenges operation within approved ranges. PQ or process performance work demonstrates the process with the site’s product, people, procedures and environment according to the buyer’s validation strategy.
This article focuses on fill-measurement and acceptance evidence. Use the separate liquid blister IQ/OQ/PQ guide for the lifecycle qualification framework and the liquid blister defects guide for troubleshooting finished-pack failures.
Diagnose patterns before changing settings
| Observed pattern | Possible paths | Check next | Avoid |
|---|---|---|---|
| All lanes shifted together | Target, density conversion, product temperature, supply condition or common calibration | Verify method, target, density, temperature and common settings | Adjusting individual nozzles first |
| One lane consistently high or low | Nozzle, valve, dosing part, timing, tare mapping or obstruction | Trace physical lane, inspect parts and repeat mapped measurements | Averaging the lane into the total |
| Variation increases with time | Temperature, aeration, wear, settling, tank level or measurement drift | Plot results with process and check-standard data | Comparing only first and last averages |
| Short fills after restart | Priming, trapped air, pressure recovery, dripping or reject timing | Observe restart sequence and count recovery units | Discarding units without recording them |
| Weight passes but cavities look different | Card-level averaging, forming variation, product distribution or imaging limitation | Measure individual cavities and map the pack | Assuming total card mass proves every cavity |
What belongs in the URS?
- Product and dosage-form boundary
- Target fill and approved limits
- Mass or volume reporting basis
- Density and temperature method
- Rheology and product-handling range
- Number of lanes and cavity map
- Approved production speed range
- Startup, refill and restart rules
- Measurement equipment and traceability
- Sampling and calculation method
- Inspection and rejection boundary
- Raw-data and electronic-record needs
- FAT evidence and deviation process
- Site qualification responsibility
Questions to ask a liquid blister machine supplier
- Which dosing principle and product-contact path are proposed for this formulation?
- Which product properties and samples were reviewed?
- How is each nozzle mapped to the finished cavity?
- Which parts, supply conditions and settings can change delivered amount?
- How are priming, refill, stops and restarts controlled and rejected?
- Which measurement method and raw data will be used during FAT?
- Which operating conditions and risk-driving formats will be tested?
- What does vision or weighing detect, and what does it not prove?
- Which documents, software records and calibration evidence are supplied?
- Which conclusions must be confirmed later with actual product at the site?
Send these inputs for a useful dosing review
Provide the product type, safe technical description, target fill, limits, density and temperature method, viscosity or rheology range, solids or foaming behavior, cavity drawing, forming material, number of lanes, expected output, operating conditions, cleaning needs, inspection boundary, data requirements and FAT expectations.
If information is not yet known, label it as an open item. The liquid blister machine selection guide can help organize the wider equipment decision, while the liquid blister packaging machine page covers the product and configuration route.
Frequently asked questions
What is an acceptable liquid blister fill-volume accuracy?
There is no universal percentage for every product. The product owner should define target, individual and average limits from the approved product and process requirements. The FAT must state the method, sample design, lanes, conditions and calculation used to demonstrate those limits.
Does ±1% mean every filled cavity must be within ±1%?
Not necessarily. The phrase is ambiguous unless it states whether it applies to every unit, the mean, bias, spread, pump setting or another statistic. Write individual-unit and average requirements separately and identify the tested population.
How is liquid blister fill volume measured gravimetrically?
Measure net filled mass using an approved tare method, then divide by product density at the relevant temperature when a volume result is required. Control balance suitability, density determination, timing, evaporation, residue, bubbles, rounding and raw-data traceability.
How many samples and how long should a fill-accuracy FAT run?
No single duration or sample count fits every project. Justify the plan from risk, number of lanes, operating states, expected variability, measurement capability and the decision required. Cover cavities, time and relevant conditions rather than testing one convenient sample.
Can a vision system prove fill volume?
A qualified vision system can detect defined visible conditions such as level, presence or foam. It does not automatically prove true volume, mass or chemical content. Validate the observable defect boundary and challenge the image-to-reject chain.
Can a checkweigher identify an underfilled cavity?
A card-level checkweigher may detect a total mass difference but cannot automatically identify the affected cavity. Individual-cavity verification requires a suitable measurement architecture and a traceable cavity-to-result map.
Should Cpk be required for liquid blister dosing?
Use capability indices only when the process is stable, the sample is adequate and the distribution assumptions are justified. NIST notes that capability compares an in-control process with specification limits; a Cpk threshold should come from the buyer’s approved statistical strategy, not a universal supplier claim.
What should be sent before requesting a liquid blister machine trial?
Send target fill and limits, product density and temperature method, rheology range, representative material, cavity drawing, lanes, output, startup and refill conditions, cleaning and safety needs, inspection and records, and the proposed FAT acceptance method.
Source boundary: measurement and capability concepts use the NIST Engineering Statistics Handbook. Validation context uses the FDA’s Process Validation guidance, its current CGMP production and process-control Q&A, and EU GMP Annex 15 within their stated scopes. The article does not assign a universal tolerance, sample size, test duration, pump ranking or regulatory applicability.
Define your fill-accuracy FAT before comparing machines
Send your product condition, target fill, limits, cavity layout, required output and measurement method. HIJ can respond with a dosing configuration and test boundary tied to those inputs.