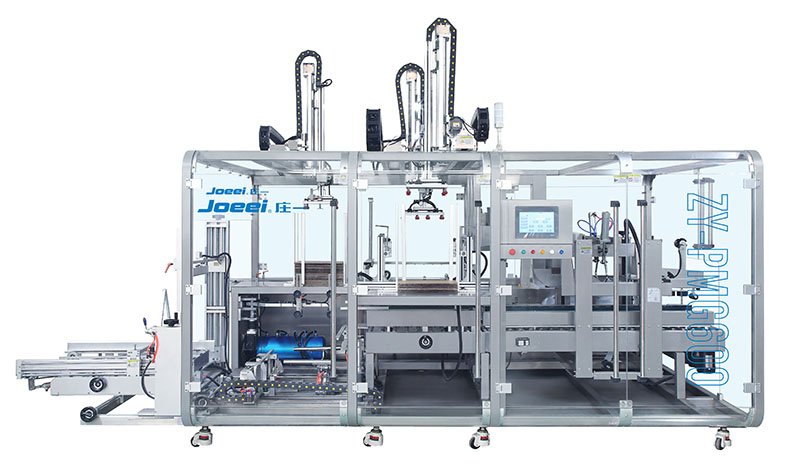
Blister line capacity planning guide
Sizing a blister packaging machine means proving that a proposed configuration can deliver the required accepted packs within the real production calendar. Catalog cycles per minute are only one input. Pack layout, feeding, materials, inspection, changeovers, cleaning, downstream equipment and acceptance rules determine whether that speed becomes usable output.
This guide provides a calculation path for project, production and procurement teams. It keeps demand assumptions separate from demonstrated machine performance, so competing proposals can be compared on the same counting unit, time boundary and test method.

Planning note: no universal speed, OEE, reserve percentage or machine model can be selected from annual volume alone. Use approved product and pack information, an agreed operating calendar and evidence from the proposed configuration.
Direct answer
How do you size a blister packaging machine?
The calculation has three layers. The demand layer states what the business must supply. The schedule layer states when the line can actually make it. The equipment layer states what the complete configured process can demonstrate. Keep the layers visible. A hidden assumption in any layer can make a proposal appear adequate while leaving the production plan short.
Machine sizing is also not the same as measuring the output of an installed machine. If you need to diagnose a running line, use the separate blister machine output calculation guide. This article works in the opposite direction: it converts a future supply requirement into testable procurement requirements.
Sizing sequence
Use one traceable path from demand to acceptance
Each step should leave a document that can be reviewed: demand table, pack conversion, calendar, format matrix, line boundary and test protocol. If a proposal changes an assumption, the impact should be recalculated rather than buried in a revised headline speed.
Demand boundary
Begin with accepted demand, not machine speed
Use the unit that production planning is expected to deliver: accepted blister cards, cartons or doses available for the next controlled step. Do not begin with total pieces fed into the machine. Product loaded into a cavity but later rejected, held for investigation or lost during start-up does not satisfy accepted demand.
Annual demand alone hides the calendar. A product may have a seasonal peak, a short launch window, a restricted campaign, or an expiry-related requirement. Two projects with the same annual total can require different equipment because one can spread production across the year while the other must complete a batch or campaign within a narrow window.
| Demand input | What to record | Why it changes sizing |
|---|---|---|
| SKU and market | Product, strength, pack count, language or artwork family and destination. | Different packs can require different tooling, coding, inspection and changeover work. |
| Accepted quantity | Units needed by month, campaign or batch—not only the forecast average. | The peak required rate can be higher than the annual-average rate. |
| Service boundary | Date or production window by which accepted packs must be ready. | Available time, warehouse policy and release steps affect the required schedule. |
| Batch structure | Batch sizes, campaign sequence and permitted product grouping. | Small batches create more set-up, cleaning and reconciliation time per accepted pack. |
| Uncertainty | Base case, approved upside case and decision date for additional demand. | Named scenarios are clearer than hiding uncertainty inside one speed factor. |
If the forecast is expressed in tablets, capsules, ampoules or devices, first convert it to the intended saleable blister. Keep the conversion table in the sizing file. Marketing pack changes can then be recalculated without confusing a dose forecast with a card forecast.
Pack conversion
Define the counting unit and approved pack drawing
A speed statement is incomplete without its unit. “120 per minute” could mean machine cycles, formed cavities, product units, blister cards or cartons. Every requirement, quotation and test report should state the numerator and time boundary in full.
The approved drawing then determines how many complete cards can be produced per stroke or index. That value depends on cavity arrangement, web direction, pitch, trim, registration and cutting pattern. It is not interchangeable with the number of cavities formed in an uncut web. If one web index contains multiple cards, document how those cards are separated and counted.
Use exact product dimensions and presentation requirements. The pill size and blister machine guide explains why nominal tablet or capsule names are not enough for cavity and feeding decisions. Samples and a controlled dimension set are more useful than a generic product label.
- identify the accepted card orientation, overall dimensions, cavity count and cavity positions;
- show web direction, forming and lidding materials, registration features and printed areas;
- state whether each cycle produces one or several finished cards and how edge or startup material is treated;
- define good-pack criteria for presence, seal, registration, code, cut position and appearance; and
- use the same counting rule for demand, FAT data and production reporting.
Production calendar
Calculate net available production time before rate
Calendar time is not automatically production time. Begin with the time assigned to this product family, then subtract only the planned categories that the approved production plan treats as unavailable for making accepted packs. Keep unplanned losses separate so they can be modeled or demonstrated without being counted twice.
Document the boundary of each term. If breaks are covered by relief operators, they may not stop production; if the site shuts the line, they do. If routine in-process sampling occurs while the line runs, do not also subtract the full sampling duration. If cleaning is scheduled between product families, allocate it to the correct campaign rather than applying it arbitrarily to every batch.
| Time category | Question to settle | Evidence or owner |
|---|---|---|
| Allocated shifts | How many staffed hours are assigned to the blister line and this product family? | Approved production calendar and staffing plan. |
| Format changeover | From which defined format to which other format, measured from what event to what event? | Changeover procedure, observed trial or agreed project target. |
| Product cleaning | What cleaning level, inspection and release are required between campaigns? | Site cleaning strategy and approved procedure. |
| Planned maintenance | Which tasks occur inside the planning period and remove line availability? | Maintenance plan and production schedule. |
| Testing and qualification | Will engineering, validation or stability work use the same line? | Project and quality calendars. |
| Downstream allocation | Can the required cartoner, case packer or personnel support the same window? | Integrated-line plan and resource owner. |
A sizing spreadsheet should show both gross allocated time and net planned run time. That makes future changes visible: adding a shift, reducing a changeover or moving engineering batches changes the time boundary without pretending the machine itself became faster.
Required rate
Convert the production plan into accepted packs per minute
This is the minimum average accepted rate across the defined production window. It is not yet a machine setting. The proposed equipment must overcome the losses that occur between its ideal format rate and accepted output. Those losses can include brief stops, reduced running speed, empty or misfed cavities, seal or registration defects, code failures, inspection rejects and downstream interruptions.
Choose one transparent loss model. One approach applies separately documented availability, performance and quality factors. Another uses demonstrated accepted output from a representative trial. Do not apply OEE and then subtract the same stops and rejects again. For a full explanation of measured rate, loss categories and units, see the real-output calculation worksheet.
Each factor requires a source and a boundary. Data from a different product, feeder, material, format or downstream configuration may be useful as a reference but does not prove the new project. If reliable evidence is unavailable, mark the assumption as provisional and make confirmation part of the trial or FAT.
Planning reserve
Keep capacity reserve separate from operating losses
Planning reserve covers a defined uncertainty or future scenario. It should not be a universal percentage added without explanation. Name the reason: forecast upside, a planned new SKU, temporary overlap during launch, maintenance recovery, a service-level requirement or a future shift constraint. Then show how much capacity that scenario requires and when the decision will be revisited.
Operating losses describe the difference between ideal and accepted output during the agreed period. Growth is a demand scenario. Mixing them can double-inflate the selected machine. For example, increasing demand for a growth case and also embedding the same growth inside a “safety factor” produces an undocumented surplus.
| Item | Where it belongs | How to document it |
|---|---|---|
| Forecast upside | Demand scenario | Quantity, probability, decision date and required service window. |
| Micro-stops | Operating performance | Defined event boundary and representative evidence. |
| Rejected packs | Quality loss | Acceptance definition, cause categories and counted disposition. |
| Changeover and cleaning | Planned calendar | SKU sequence, start/end events and approved time allowance. |
| Future SKU | Separate configuration scenario | Preliminary product, material and pack assumptions plus confirmation plan. |
| Recovery requirement | Business continuity scenario | Backlog quantity, recovery window and available extra shifts. |
Report the base case and each approved scenario independently. Procurement can then see whether a proposal passes the current need, the growth need or both, and which assumptions create the difference.
Product and pack
Identify variables that change achievable capacity
Two formats with the same number of cavities may not run at the same accepted rate. Product behaviour affects feeding; web structure affects forming and sealing; card geometry affects index length and cutting; printing and vision requirements affect control and reject logic. Size the project around the format matrix rather than a single representative number.
| Variable | Capacity mechanism | Information to provide |
|---|---|---|
| Product geometry | Orientation, bridging, nesting, chipping or rebound can limit feeding and fill consistency. | Controlled samples, dimensions, tolerances, images and handling restrictions. |
| Product condition | Dust, static, surface friction, fragility and batch variation affect transport and inspection. | Representative production batches and acceptable handling method. |
| Cavity and card layout | Pitch, web use and cards per cycle determine theoretical format output. | Approved drawing with web direction and cutting pattern. |
| Forming web | Material structure, gauge and cavity geometry determine the forming process window. | Approved specification and supplier samples. |
| Lidding web | Seal compatibility, print registration and code area affect process control. | Approved structure, artwork and registration requirements. |
| Inspection scope | Required checks, decision time and reject confirmation affect line logic and acceptance. | Defect list, acceptance criteria, challenge samples and data needs. |
| Finished card criteria | Seal, registration, code and cut requirements determine what counts as accepted. | Specifications, test methods, sampling and disposition rules. |
The blister packaging materials guide helps organize forming- and lidding-material questions. Final material selection and the validated process window remain product- and pack-specific.
Feeding and rejects
Test the feeder with representative product
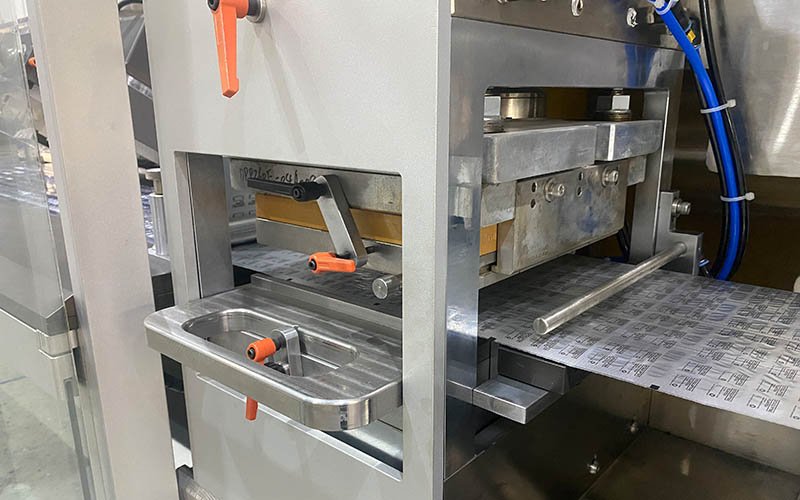
For many blister projects, feeding is a capacity constraint before the base machine reaches its nominal cycle rate. A feeder must deliver the correct product to every required cavity without unacceptable damage, empty pockets or operator intervention. The relevant result is sustained accepted output, not a brief mechanical speed with no product.
Define manual and automatic steps. If an operator spreads product, clears tracks, replenishes a hopper, checks orientation or handles rejected cards, record the expected frequency and ergonomic access. A configuration that meets rate only through continuous exceptional intervention is not equivalent to a stable production method.
- use representative commercial or engineering batches rather than perfect hand-selected samples;
- state the acceptable empty-cavity, wrong-product, damage and double-fill rules;
- challenge low and high hopper levels and normal replenishment;
- record every stop, speed reduction, manual intervention and rejected card;
- confirm that inspection timing, position tracking and physical rejection remain synchronized; and
- separate feeder losses from seal, print, registration, cut and downstream losses.
Where several SKUs use different feeding methods, calculate each one. The slowest high-volume SKU may size the line, while a difficult low-volume SKU may instead size campaign time or justify a different feeder strategy.
Line bottleneck
Size the integrated line on a common output unit
A blister machine does not create saleable cartons if downstream equipment cannot accept its output. Convert every required station to the same unit and time boundary. For example, compare accepted blister cards per minute at the blister machine, card transfer, cartoner, checkweigher, serialization aggregation and manual case-packing step. State any accumulation or buffer and what happens when it fills.
Name product-to-carton conversion explicitly. A cartoner rated in cartons per minute may accept one, two or another number of blister cards per carton. Its apparent headline rate can therefore be misleading until it is converted to the project’s card rate. Leaflet insertion, coding, tamper evidence and inspection can also define the usable result.
| Interface | Sizing questions | Acceptance observation |
|---|---|---|
| Blister discharge | How are good and rejected cards separated and counted? | Confirmed transfer, reject segregation and counter reconciliation. |
| Card-to-carton loading | How many cards enter each carton and how are missing or extra cards detected? | Sustained loading with intended card and carton materials. |
| Leaflet and coding | Which component presence, code and artwork checks are required? | Normal and challenge results with reject disposition. |
| Serialization | What data handshake, line stop and recovery behaviour applies? | Successful transactions plus defined communication-failure recovery. |
| Accumulation | What event does the buffer absorb and for how long? | Downstream stop, fill response, restart and reconciliation. |
| Manual packing | How many trained operators and what replenishment or removal pattern is assumed? | Observed workload, access and sustained performance. |
Changeovers
Model the SKU mix, not only the fastest format
High-mix production can lose more capacity to transitions than to running speed. Build a format matrix and a changeover matrix. The format matrix shows product, pack, material, feeder, tooling, artwork, inspection and downstream configuration. The changeover matrix shows which transition is performed, its start and end events, cleaning level, staffing and evidence.
“Changeover time” is ambiguous unless its boundary is defined. It may start at the last accepted card of the previous batch and end at mechanical setup, first formed web, first sealed card, first accepted card, quality approval or stable production. Use the boundary that the production schedule actually needs, and keep waiting for external release visible where applicable.
Separate internal and external work. Tool preparation, material staging and document checks may occur before the line stops if the site procedure permits. Mechanical conversion, line clearance and product-contact cleaning require a different window. This distinction helps teams improve scheduling without assuming an unsupported machine capability.
For every important transition, record personnel, tools, lifting or handling aids, recipe change, parts verification, line-clearance checks, first-off inspection and release. The result belongs in net available time, not hidden inside a generic efficiency factor.
Facilities and operation
Confirm that the site can support the proposed capacity
A machine that fits the output calculation can still fail the installation plan. Equipment size and location must support intended operation, cleaning and maintenance. For pharmaceutical drug manufacturing, 21 CFR 211.63 states that equipment must be appropriately designed, adequately sized and suitably located for those purposes. The project therefore needs more than a footprint rectangle.
- confirm installation route, operating footprint, guard opening, tooling removal and maintenance access;
- define utilities at required quality and at the machine connection, including credible simultaneous demand;
- show material, product, personnel, rejected-product and waste flows around the line;
- check environmental conditions that affect approved materials, product handling and electronics;
- identify operator positions, replenishment frequency, lifting, visibility and safe intervention; and
- define upstream product supply and downstream packaging-material replenishment for the planned rate.
Utilities and staffing should be checked during the same sustained-run boundary used for capacity. A short demonstration with preloaded materials may not reveal whether normal replenishment, compressed-air demand, dust extraction, temperature control or operator workload is adequate.
Proposal comparison
Normalize supplier proposals before comparing speed
Provide every supplier with the same input pack. Ask them to respond in the same table and identify exclusions, assumptions and tests. A lower headline speed with representative product evidence may be more useful than a higher number measured with an empty web or different format.
| Comparison field | Required supplier response | Reason |
|---|---|---|
| Rated unit | Cycles, cards, product units or cartons per minute, stated without abbreviation. | Prevents unlike units from appearing comparable. |
| Reference format | Drawing, cards per cycle, product, materials and tooling configuration. | Connects the rate to a physical pack. |
| Rate status | Design target, standard-machine limit, previously observed result or project guarantee condition. | Separates intention from evidence. |
| Included operations | Feeding, inspection, coding, cutting, transfer and downstream scope. | Defines the real line boundary. |
| Acceptance definition | What counts as a good pack and how stops, rejects and startup output are recorded. | Creates a common numerator. |
| Test boundary | Run duration, replenishment, samples, operators, planned stops and data source. | Creates a common denominator. |
| Unconfirmed items | Samples, trials, materials, site utilities or interfaces still required. | Keeps procurement risk visible. |
Ask for the speed-by-format matrix rather than one maximum. If the supplier cannot yet confirm a value, record a provisional range only as such and define the test that will replace it. Do not turn a preliminary sales estimate into an accepted production guarantee.
FAT evidence
Verify capacity with accepted output and recorded losses
The performance test should reproduce the conditions that matter to the capacity claim. FDA’s process-validation guidance describes process qualification as confirming that the process design can perform reproducibly at commercial manufacturing, followed by continued verification during routine production. Supplier FAT can contribute equipment evidence, but site installation, approved materials, trained operators and the manufacturer’s validation lifecycle remain separate responsibilities.
| Protocol field | Define before the run | Record during and after |
|---|---|---|
| Configuration | Machine, feeder, tooling, software/recipe, inspection and downstream versions. | As-tested identification and approved deviations. |
| Product and materials | Batch or sample identity, quantity, conditioning and approved specifications. | Consumed, returned, waste and sample disposition. |
| Time boundary | Start/end events, warm-up treatment, replenishment and permitted planned stops. | Scheduled time, run time, every stop and reason. |
| Output counters | Cycle, cavity, card, carton and reject counting logic. | Raw totals and reconciliation to accepted packs. |
| Acceptance criteria | Presence, damage, seal, registration, code, cut and other approved checks. | Samples, measurements, defects and final disposition. |
| Interventions | Normal operator tasks and prohibited exceptional assistance. | Who intervened, why, duration and resulting material. |
| Pass/fail rule | Required accepted output, quality results and allowed deviation process. | Calculated result, review, deviations and approval status. |
Use the lowest agreed representative condition where the project must support several formats, or test the formats whose risks differ. A single easy format cannot prove feeding, forming, sealing or cutting performance for every product in the matrix.
Decision worksheet
Complete this sizing sheet before requesting a machine
| Input | Project value | Source or approval |
|---|---|---|
| Accepted demand | _____ cards per _____ by SKU and scenario | Sales and operations plan |
| Product-to-card conversion | _____ accepted units per card | Approved pack definition |
| Net planned run time | _____ minutes per campaign/period | Production calendar |
| Required accepted rate | _____ cards per minute | Demand ÷ net planned minutes |
| Format output | _____ finished cards per cycle | Approved tooling drawing |
| Product and materials | Samples/specifications attached: yes / no | Technical and quality approval |
| Complete line boundary | Included stations and interfaces: _____ | URS and responsibility matrix |
| Demonstrated result | _____ accepted cards per _____ | Representative test/FAT report |
| Planning scenarios | Base / peak / growth / recovery | Named owner and decision date |
| Acceptance status | Pass / deviation / pending evidence | Approved protocol and review |
The sheet is intentionally blank. Filling it with invented industry averages would make the calculation look complete while moving uncertainty out of sight. Where evidence is missing, write “pending trial” and assign an owner and date.
Common errors
Avoid these blister machine sizing mistakes
- Using annual average alone: it ignores peak periods, campaign windows, batch structure and SKU transitions.
- Calling cycles “packs”: the conversion depends on the actual finished-card layout and cutting pattern.
- Applying a universal OEE: the factor needs a defined boundary and relevant evidence; otherwise it is only an assumption.
- Counting the same loss twice: subtracting changeovers from time and again inside an overall factor understates capacity.
- Testing an easy substitute: another product or material may not reproduce feeding, forming, sealing and inspection constraints.
- Ignoring downstream equipment: blister cards are not finished cartons when cartoning or other operations are required.
- Hiding manual work: sustained output must include normal replenishment, intervention and operator availability.
- Accepting a short peak: a momentary rate does not establish output across the agreed production or test boundary.
- Buying only for a hypothetical future: future formats should be documented scenarios with confirmation points, not unlimited flexibility claims.
- Leaving acceptance until FAT: product, material, time, counting and pass/fail rules must be agreed before the test begins.
Primary references
Use official requirements within the project’s actual scope
The sources below support the equipment-location and validation principles used in this guide. They do not prescribe a universal blister machine speed, OEE or reserve percentage.
Questions from project teams
Blister packaging machine sizing FAQ
What information is needed to size a blister packaging machine?
Provide accepted demand by SKU and period, the production calendar, product samples and dimensions, approved pack drawings, forming and lidding materials, inspection and coding requirements, required downstream operations, changeover and cleaning rules, utilities, and an agreed FAT acceptance boundary.
Should I size the machine from annual volume?
Annual volume is only a starting point. Convert demand into the shortest meaningful production window and include batch sizes, campaigns, peaks, changeovers, cleaning and line allocation. Two projects with the same annual volume can require different accepted rates.
Is cycles per minute the same as blister packs per minute?
No. Finished cards per minute equal verified cycles per minute multiplied by finished cards per cycle for the approved layout. Cavities, product units, uncut web sections and cartons are different units and must be converted explicitly.
What OEE should I use for a new blister line?
There is no universal value that is reliable for every product, format, feeder, shift pattern or line boundary. Use relevant documented evidence where available, keep provisional assumptions visible, and replace them with representative trial or FAT data.
How much spare blister machine capacity should I buy?
Do not apply an unexplained standard percentage. Model each reason separately, such as forecast upside, a future SKU or backlog recovery, and state its quantity, timing, probability and required production window. Keep that planning reserve separate from operating losses.
Which format should be used for the capacity test?
Use the format or formats that represent the project’s relevant risks. Consider feeding difficulty, pack layout, material process window, inspection, cutting and downstream conversion. Testing only the easiest format does not prove every SKU in the matrix.
Does FAT prove production capacity?
FAT can demonstrate the contracted configuration under its defined product, material, duration, operator and acceptance conditions. It does not replace site installation, utilities, site procedures, trained personnel, qualification or continued verification in routine production.
What should I send suppliers so their quotations are comparable?
Send one controlled input pack containing the demand and format matrices, samples, drawings, material specifications, accepted-pack criteria, line boundary, utilities, documentation scope and FAT protocol. Require each supplier to state units, assumptions, exclusions, unconfirmed items and evidence on the same response sheet.
Turn your production plan into a testable capacity requirement
Share the demand by SKU, pack drawings, product and material samples, available production calendar, downstream scope and acceptance criteria. HIJ can review the conversion from required accepted output to a proposed blister-line configuration and FAT plan.
About this guide: prepared for production, engineering, validation and procurement teams planning blister packaging capacity. Final equipment selection depends on verified project inputs and agreed acceptance evidence.